Follow our new LinkedIn page:
🚨 EXTRA
GOLD MADE AN ALL-TIME HIGH of $2,729 per ounce this morning. Its is up 32% since January 1st, vs +22.5% for the S&P 500 and +20% for the Nasdaq 100. For what is driving the price, see Gold: The Barbarian is Back.
1
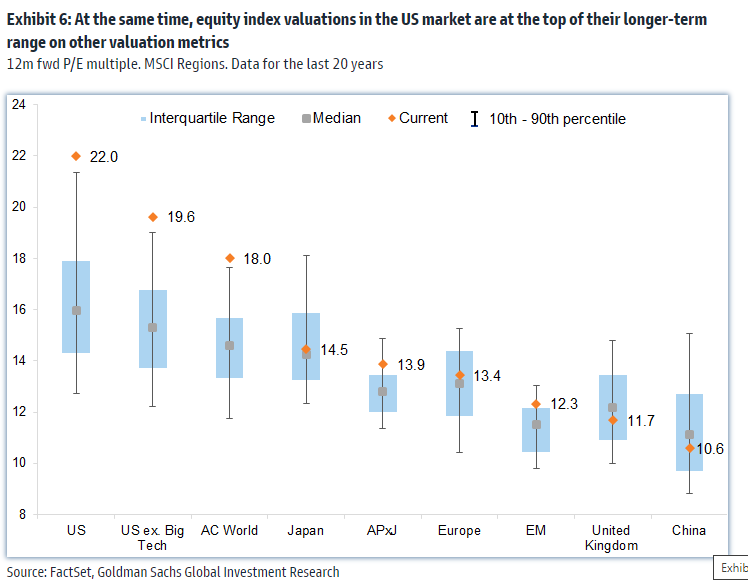
There are many reasons to be cautious in today’s US stock market. One of them is valuation. The current VALUATIONS OF MARKETS BY COUNTRY or region are shown in the chart. The historic range is in each case shown by the bar and the median is shown by the grey marker. The current valuation is the orange marker. The US stock market is now valued higher than its 90th historic percentile. In other words, it is in rare territory that it has only visited 5 or 10% of the time in the past. This is true whether we look at the market as a whole, or whether we strip the tech sector out of the calculation. Japan’s market is close to its median historic valuation, as is Europe’s. The UK and China appear relatively inexpensive. The US stock market has been carried by a huge wave of liquidity and by excitement about AI. It can sustain its current valuation as long as these two pillars remain strong.
2
It was three years ago in TWL 086 that we first mentioned the rising price of uranium in the context of the energy transition. We wrote at the time that “the main driver of this surge is the once uncomfortable but now growing realization that the rich world will have to revert to nuclear energy in order to reduce its dependence on fossil fuels. It has been known for a while by most experts that alternative sources of energy would not develop fast enough and are not sufficient on their own to displace coal, oil and natural gas.” Since that date in October 2021, the price of uranium has nearly doubled and the VANECK URANIUM & NUCLEAR ENERGY ETF has risen 70% (chart). This year, it is getting an additional boost from the realization that AI data centers will require huge amounts of electricity and that nuclear will play an important role in the supply of that electricity. Below the chart are the VanEck ETF’s top ten holdings.
3
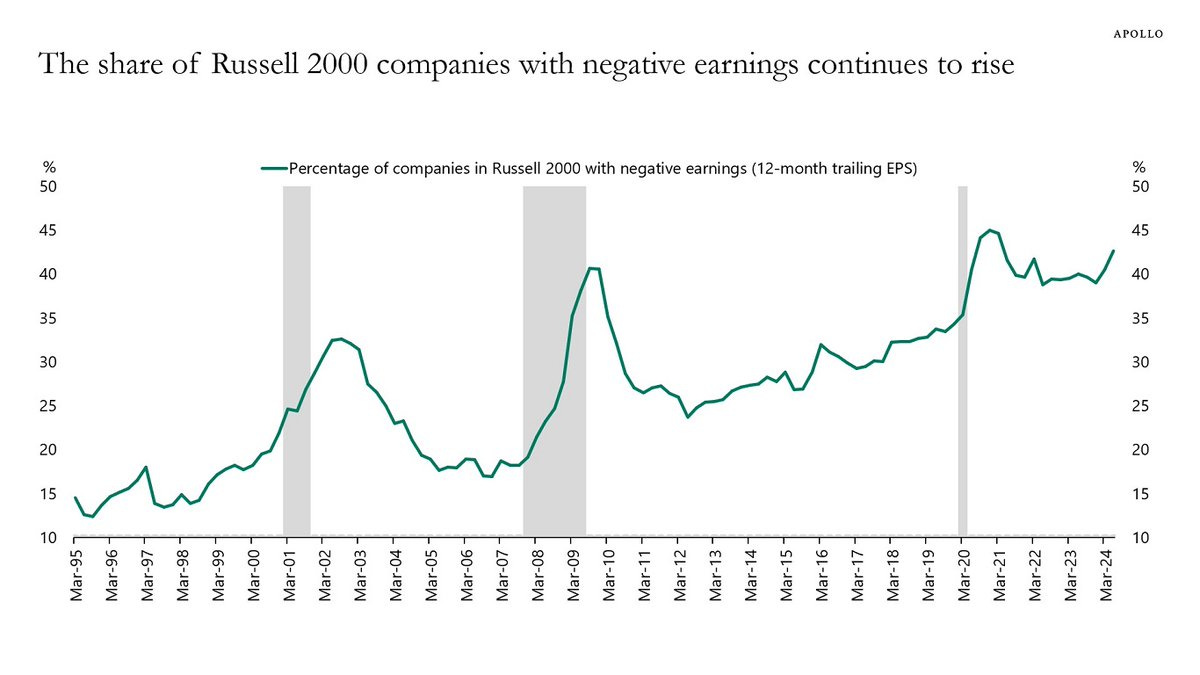
Small company stocks have underperformed large ones in the current bull market. And the reason is explained in this chart from Apollo’s Torsten Sløk. The SHARE OF RUSSELL 2000 COMPANIES WITH NEGATIVE EARNINGS is high and has been moving higher. In fact, if we look back thirty years, it was only this high during or shortly after the recessions of 2001, 2008-09 and 2020. Sløk attributes the losses to high interest rates and companies having “to pay their higher debt servicing costs.” The Fed rate cut and steepening of the yield curve should be helpful to a large number of small companies. On the current macro trajectory, we expect the line in the chart to bend down and the Russell 2000 to perform better in the months ahead. This assumes stable conditions in the overall market.
4
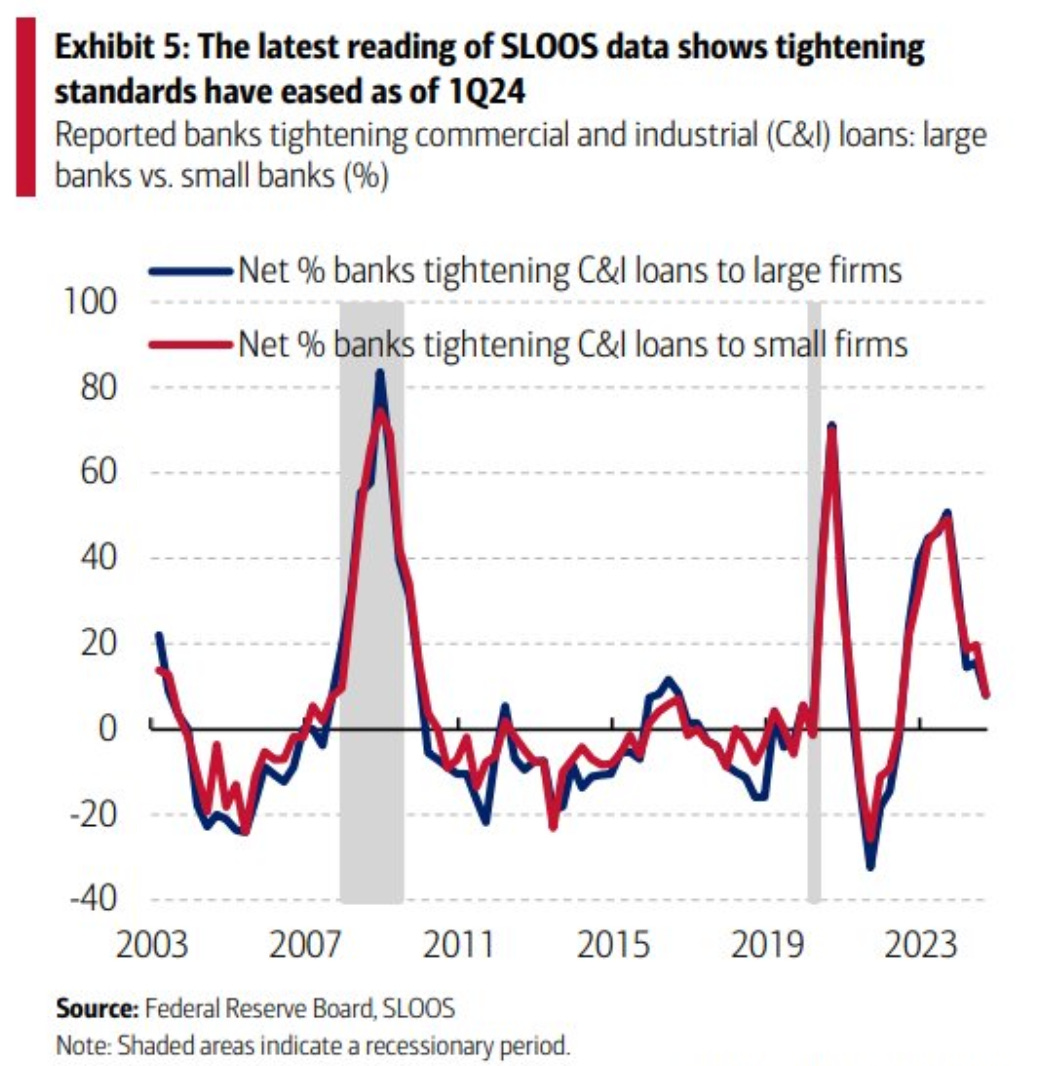
The problem of debt servicing by smaller companies may be slowly receding. This chart shows that LENDING CONDITIONS HAVE BECOME EASIER FOR LARGE AND SMALL FIRMS. On current trends, the share of small companies with negative earnings (chart under item 3 above) will peak and will start declining.


