1
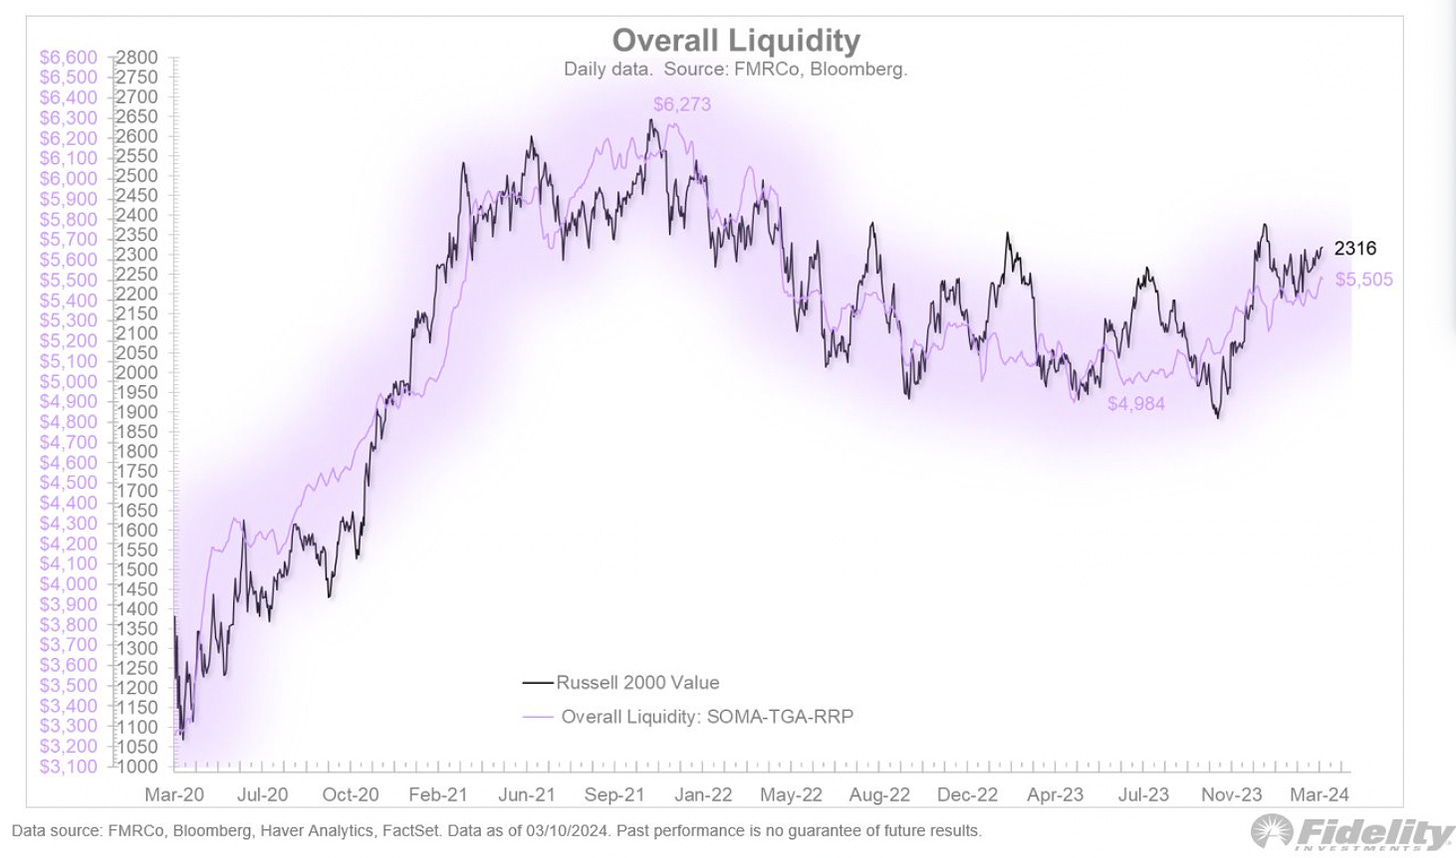
We mentioned several times that A LIQUIDITY WAVE had lifted the equity market since late 2020 and again since October 2022. There are many ways to calculate liquidity. In this case, Jurrien Timmer, director of global macro at Fidelity uses “overall liquidity, as defined by the Fed’s balance sheet, less reverse repos (RRP) less the Treasury’s cash balance at the Fed (TGA)”. In the chart, Timmer plots this liquidity in purple against the Russell 2000 index. We noted in this week’s Wednesday Letter that the Russell 2000 had significantly underperformed the major equity indices for several years. If liquidity is on the rise again, as Timmer believes, the Russell should perform better in coming weeks and months. (via @TimmerFidelity)


